LeakCanary2.x
LeakCanary
LeakCanary2.x 介绍
LeakCanary2.x 自动检测的对象:
- destroyed Activity instances
- destroyed Fragment instances
- destroyed fragment View instances
- cleared ViewModel instances
- destroyed Service instance
LeakCanary2.0+ 采用了新的 hprof 分析工具 shark 替换了原来的 haha,主要做了hprof 文件裁剪和实时监控。
hprof 文件裁剪
LeakCanary2.x 用 shark 组件来实现裁剪 hprof 文件功能,通过将所有基本类型数组替换为空数组(大小不变)
实时监控
在 Activity 或者 Fragment 的 destroy 生命周期后,可以检测 Activity 和 Fragment 是否被回收,来判断它们是否存在泄露的情况。
LeakCanary2.x 使用
如何初始化?
自动在主进程初始化
debugImplementation ‘com.squareup.leakcanary:leakcanary-android:2.2’
会自动通过 MainProcessAppWatcherInstaller 进行注册
手动在主进程初始化
- 配置
<bool name="leak_canary_watcher_auto_install">false</bool> - 手动调用
AppWatcher.manualInstall()注册
如何判断注册成功?
在 Logcat 中过滤 tag 为 LeakCanary 输出如下 log:
LeakCanary is running and ready to detect memory leaks.
LeakCanary2.x 原理(v2.10)
AppWatcher
通过 MainProcessAppWatcherInstaller 主动注册或者手动注册,最终都是走到 AppWatcher.manualInstall(application),往下走:
1
2
3
4
5
6
7
8
9
10
11
12
13
14
15
16
fun manualInstall(
    application: Application,
    retainedDelayMillis: Long = TimeUnit.SECONDS.toMillis(5),
    watchersToInstall: List<InstallableWatcher> = appDefaultWatchers(application)
) {
    // ... 一些条件校验
    installCause = RuntimeException("manualInstall() first called here")
    this.retainedDelayMillis = retainedDelayMillis
    // ...
    // Requires AppWatcher.objectWatcher to be set
    LeakCanaryDelegate.loadLeakCanary(application)
    // 遍历install开始监测对象
    watchersToInstall.forEach {
      it.install()
    }
}
参数 2:retainedDelayMillis 默认 5 秒 参数 3:watchersToInstall 需要观察的对象,在 appDefaultWatchers 中有定义;可定义增加或删除观察的对象
看看 appDefaultWatchers():
1
2
3
4
5
6
7
8
9
10
11
12
13
14
15
16
17
18
19
20
21
val objectWatcher = ObjectWatcher(
    clock = { SystemClock.uptimeMillis() },
    checkRetainedExecutor = {
      check(isInstalled) {
        "AppWatcher not installed"
      }
      mainHandler.postDelayed(it, retainedDelayMillis)
    },
    isEnabled = { true }
)
fun appDefaultWatchers(
    application: Application,
    reachabilityWatcher: ReachabilityWatcher = objectWatcher
): List<InstallableWatcher> {
    return listOf(
        ActivityWatcher(application, reachabilityWatcher),
        FragmentAndViewModelWatcher(application, reachabilityWatcher),
        RootViewWatcher(reachabilityWatcher),
        ServiceWatcher(reachabilityWatcher)
    )
}
默认观察了 4 种对象:
- Activity 对象
- Fragment 对象
- View 对象
- Service 对象
接着看下 LeakCanaryDelegate.loadLeakCanary(application):
1
2
3
4
5
6
7
8
9
10
11
12
internal object LeakCanaryDelegate {
    val loadLeakCanary by lazy {
        try {
          val leakCanaryListener = Class.forName("leakcanary.internal.InternalLeakCanary")
          leakCanaryListener.getDeclaredField("INSTANCE")
            .get(null) as (Application) -> Unit
        } catch (ignored: Throwable) {
          NoLeakCanary
        }
    }
  // ...
}
反射获取了 InternalLeakCanary 的 INSTANCE 字段,返回一个 InternalLeakCanary 对象(InternalLeakCanary 是一个 (Application)->Unit 的方法对象)
InternalLeakCanary 类定义:internal object InternalLeakCanary : (Application) -> Unit, OnObjectRetainedListener
其实最终调用的是 InternalLeakCanary 的 invoke 方法:
1
2
3
4
5
6
7
8
9
10
11
12
13
14
15
16
17
18
19
20
21
22
23
24
25
26
27
28
29
30
31
32
33
34
35
36
37
38
39
40
41
42
43
44
override fun invoke(application: Application) {
    _application = application
	// 1
    checkRunningInDebuggableBuild()
	// 2
    AppWatcher.objectWatcher.addOnObjectRetainedListener(this)
	// 3
    val gcTrigger = GcTrigger.Default

    val configProvider = { LeakCanary.config }

    val handlerThread = HandlerThread(LEAK_CANARY_THREAD_NAME)
    handlerThread.start()
    val backgroundHandler = Handler(handlerThread.looper)

    // 4
    heapDumpTrigger = HeapDumpTrigger(
      application, backgroundHandler, AppWatcher.objectWatcher, gcTrigger,
      configProvider
    )
    application.registerVisibilityListener { applicationVisible ->
      this.applicationVisible = applicationVisible
      heapDumpTrigger.onApplicationVisibilityChanged(applicationVisible)
    }
    registerResumedActivityListener(application)
    addDynamicShortcut(application)

    // We post so that the log happens after Application.onCreate()
    mainHandler.post {
      // https://github.com/square/leakcanary/issues/1981
      // We post to a background handler because HeapDumpControl.iCanHasHeap() checks a shared pref
      // which blocks until loaded and that creates a StrictMode violation.
      backgroundHandler.post {
        SharkLog.d {
          when (val iCanHasHeap = HeapDumpControl.iCanHasHeap()) {
            is Yup -> application.getString(R.string.leak_canary_heap_dump_enabled_text)
            is Nope -> application.getString(
              R.string.leak_canary_heap_dump_disabled_text, iCanHasHeap.reason()
            )
          }
        }
      }
    }
}
- checkRunningInDebuggableBuild() 校验是否在 debuggable 的包运行 LeakCanary,不在 debuggable 的包默认是不行;如果需要在非 debuggable 上运行,需要配置
<bool name="leak_canary_allow_in_non_debuggable_build">false</bool>为 true - addOnObjectRetainedListener() 方法,这里会给单例的
AppWatcher.objectWatcher对象注册一个 OnObjectRetainedListener 监听,当默认的那些 AppWatcher 对象 retain 了就会回调到这里来 - GcTrigger 通过调用 Runtime.getRuntime().gc() 方法触发虚拟机进行 GC 操作
- HeapDumpTrigger 管理触发 Heap Dump 的逻辑,有两个地方会触发 dumpHeap():
- retain 的对象超过阈值(5,应用可见的情况下),可以通过 Config 配置:
val retainedVisibleThreshold: Int = 5 // LeakCanary.Config
- 当 HeapDumpTrigger 回调
onDumpHeapReceived()方法时,会执行 dumpHeap();比如通知栏收到了 Notification 点击了
appDefaultWatchers() 4 种默认对象的泄漏检测
接着回到 LeakCanary 默认定义的几个 Watcher,我们以 ActivityWatcher 为例进行讲解。
1
2
3
4
5
6
7
8
9
10
11
12
13
14
15
16
17
18
19
20
21
22
23
24
25
26
27
28
29
30
class ActivityWatcher(
    private val application: Application,
    private val reachabilityWatcher: ReachabilityWatcher // 1
) : InstallableWatcher {
  private val lifecycleCallbacks =
    object : Application.ActivityLifecycleCallbacks by noOpDelegate() {
      override fun onActivityDestroyed(activity: Activity) {
        reachabilityWatcher.expectWeaklyReachable( // 3
          activity, "${activity::class.java.name} received Activity#onDestroy() callback"
        )
      }
    }
  override fun install() { // 2
    application.registerActivityLifecycleCallbacks(lifecycleCallbacks)
  }
  override fun uninstall() { // 2
    application.unregisterActivityLifecycleCallbacks(lifecycleCallbacks)
  }
}
// AppWatcher.kt
val objectWatcher = ObjectWatcher(
    clock = { SystemClock.uptimeMillis() },
    checkRetainedExecutor = {
      check(isInstalled) {
        "AppWatcher not installed"
      }
      mainHandler.postDelayed(it, retainedDelayMillis)
    },
    isEnabled = { true }
  )
- reachabilityWatcher 就是单例 AppWatcher 变量 objectWatcher,用于探测 retained 的对象
- install()/uninstall(),注册收集要监测的 Activity 对象,通过 registerActivityLifecycleCallbacks 来收集,在 Activity 的 onActivityDestroyed 中开始探测 Activity 是否泄漏
- **objectWatcher.expectWeaklyReachable **观测 Activity 对象是否泄漏
- objectWatcher 中第二个参数 checkRetainedExecutor 其实是
(Runnable)->Unit类型
- objectWatcher 中第二个参数 checkRetainedExecutor 其实是
接着来看看:
1
2
3
4
5
6
7
8
9
10
11
12
13
14
15
16
17
18
19
20
21
22
23
24
25
26
27
28
29
30
31
32
33
34
35
36
37
38
39
40
41
42
43
44
45
46
class ObjectWatcher {
    // 1
	private val watchedObjects = mutableMapOf<String, KeyedWeakReference>()
    // 2
	private val queue = ReferenceQueue<Any>()

    @Synchronized override fun expectWeaklyReachable(
        watchedObject: Any,
        description: String
    ) {
        if (!isEnabled()) {
        	return
        }
        // 3
        removeWeaklyReachableObjects()
        val key = UUID.randomUUID().toString()
        val watchUptimeMillis = clock.uptimeMillis()
        val reference =
          KeyedWeakReference(watchedObject, key, description, watchUptimeMillis, queue)
        // 4
        watchedObjects[key] = reference
        // 5
        checkRetainedExecutor.execute { moveToRetained(key) }
    }
}
// 3
private fun removeWeaklyReachableObjects() {
    // WeakReferences are enqueued as soon as the object to which they point to becomes weakly
    // reachable. This is before finalization or garbage collection has actually happened.
    var ref: KeyedWeakReference?
    do {
      ref = queue.poll() as KeyedWeakReference?
      if (ref != null) {
        watchedObjects.remove(ref.key)
      }
    } while (ref != null)
  }
// 5
@Synchronized private fun moveToRetained(key: String) {
    removeWeaklyReachableObjects()
    val retainedRef = watchedObjects[key]
    if (retainedRef != null) {
      retainedRef.retainedUptimeMillis = clock.uptimeMillis()
      onObjectRetainedListeners.forEach { it.onObjectRetained() }
    }
  }
- watchedObjects 保存了 KeyedWeakReference 的 HashMap,key 为随机生成的数;正常回收的对象会被移除,留下来的可能是泄漏的
- queue WeakReference 的 ReferenceQueue 在对象被回收后,会将指向对象的 WeakReference 放到 queue 中去。
- **removeWeaklyReachableObjects() 【将正常回收的对象从 watchObjects 移除】 **遍历 queue,如果找到了 ref 不为 null 的(不为 null 说明对象被回收了),那么从 watchObjects 中移除掉,因为观测的这个对象已经被回收了,watchObjects 中留下来的可能是泄漏的对象 retained 了
- 将要观察的对象包装成一个 KeyedWeakReference,保存到 watchedObjects 中去
- 执行 checkRetainedExecutor.execute【延迟 5 秒看对象回收情况】,checkRetainedExecutor 定义是在 APPWatcher 的 objectWatcher,延迟五秒会调用 moveToRetained(),也就是说在 Activity 回调 onDestroy5 秒后执行;在 moveToRetained 中,首先调用 removeWeaklyReachableObjects() 将已经回收的对象移除掉,watchedObjects 中留下来的对象可能是内存泄漏的对象,回调 OnObjectRetainedListener,最终回调到 InternalLeakCanary 的
onObjectRetained()方法
其他的
AndroidXFragmentDestroyWatcher和ViewModelClearedWatcher都是类似的逻辑
HeapDumpTrigger 触发 dump heap 的逻辑
接着前面,在 5 秒后如果还存在于 watchedObjects 中,就会回调到 InternalLeakCanary 的 onObjectRetained() 方法,最终会调用到 HeapDumpTrigger 的 scheduleRetainedObjectCheck() 方法
1
2
3
4
5
6
7
8
9
10
11
12
13
class InternalLeakCanary {
    fun scheduleRetainedObjectCheck(delayMillis: Long = 0L) { // 这里的delayMillis为0L
        val checkCurrentlyScheduledAt = checkScheduledAt
        if (checkCurrentlyScheduledAt > 0) {
        	return
        }
        checkScheduledAt = SystemClock.uptimeMillis() + delayMillis
        backgroundHandler.postDelayed({ // 是在子线程中dump
        	checkScheduledAt = 0
        	checkRetainedObjects()
        }, delayMillis)
	}
}
接着看 checkRetainedObjects():
1
2
3
4
5
6
7
8
9
10
11
12
13
14
15
16
17
18
19
20
21
22
23
24
25
26
27
28
29
30
31
32
33
34
35
36
37
private fun checkRetainedObjects() {
    // ...
    // 1. 已经被回收过后的retained对象的总和
    var retainedReferenceCount = objectWatcher.retainedObjectCount

    if (retainedReferenceCount > 0) {
        // 2
        gcTrigger.runGc()
        retainedReferenceCount = objectWatcher.retainedObjectCount
    }
    // 3
    if (checkRetainedCount(retainedReferenceCount, config.retainedVisibleThreshold)) return

    val now = SystemClock.uptimeMillis()
    val elapsedSinceLastDumpMillis = now - lastHeapDumpUptimeMillis
    // 4
    if (elapsedSinceLastDumpMillis < WAIT_BETWEEN_HEAP_DUMPS_MILLIS) {
      onRetainInstanceListener.onEvent(DumpHappenedRecently)
      showRetainedCountNotification(
        objectCount = retainedReferenceCount,
        contentText = application.getString(R.string.leak_canary_notification_retained_dump_wait)
      )
      scheduleRetainedObjectCheck(
        delayMillis = WAIT_BETWEEN_HEAP_DUMPS_MILLIS - elapsedSinceLastDumpMillis
      )
      return
    }

    dismissRetainedCountNotification()
    val visibility = if (applicationVisible) "visible" else "not visible"
    // 5
    dumpHeap(
      retainedReferenceCount = retainedReferenceCount,
      retry = true,
      reason = "$retainedReferenceCount retained objects, app is $visibility"
    )
}
- **retainedReferenceCount **已经被回收过后的 retained 对象的总和,会调用 removeWeaklyReachableObjects 先判断下
- 如果存在一个 retained 对象,手动触发一下 GC;再重新计算下retainedReferenceCount
- 如果 retained 的对象小于 5 个(默认),不走下面逻辑了
- 如果 retained 的对象大于等于 5 个;距离上次 dump 时间小于 60 秒,只展示通知,delay dump heap
- retained 大于等于 5 个且距离时间大于等于 60 秒,就直接 dump heap
LeakCanary 如何分析 hprof 文件?
分析 hprof 文件的工作主要是在 HeapAnalyzerService 类中完成的;用 Sharp 分析 hprof 来分析
原理小结
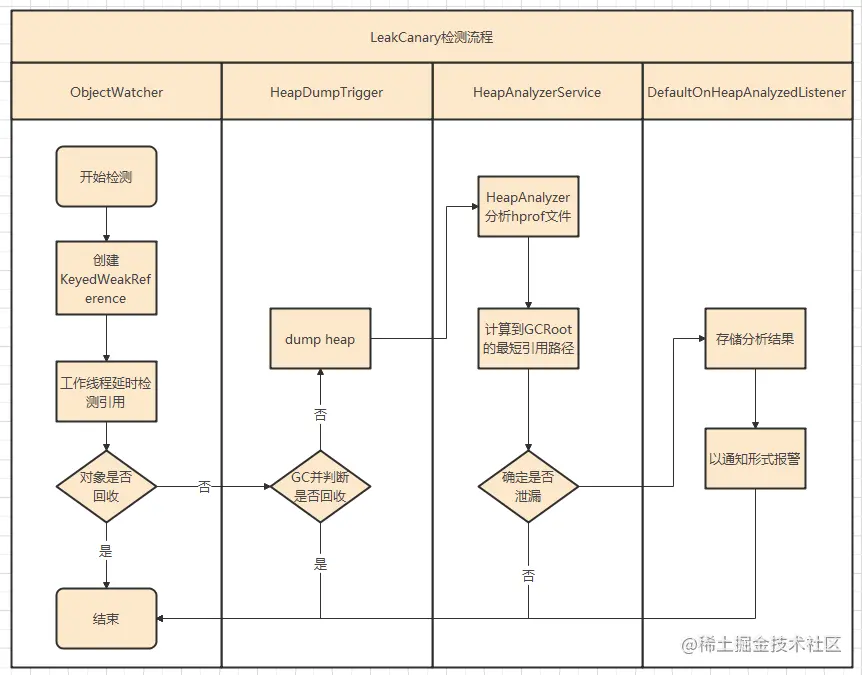
默认可以监听 Activity、Fragment、View 和 ViewModel 的泄漏,以 Activity 为例:
- 监听 Activity 生命周期
- 在 Activity onDestroy 的时候,创建一个弱引用 KeyedWeakReference 到 Activity 对象并关联一个引用队列 queue,key 是一个随机数(和当前 Activity 绑定),将 key 和 KeyedWeakReference 保存到 watchedObjects 里面
- 然后在延迟默认 5 秒后,开始检测是否内存泄漏,具体检测步骤:
- 1、判断 queue 中是否有该 Activity 的 KeyedWeakReference 对象,有则说明 Activity 被回收了,移除 watchedObjects 里面对应的 key
- 2、判断 watchedObjects 里面是否有当前要检测的 Activity 的 key,如果没有,说明 Activity 对象已经被回收了,没有内存泄漏;如果有,只能说明 Activity 对象还没有被回收,可能此时已经没有被引用,不一定是内存泄漏
- 手动触发一次 GC
- dump heap 分析 hprof 文件,构建可能泄漏的对象与 GC Root 的引用链,如果存在则泄漏了
- 存储结果并使用 Notification 提醒用户存在泄漏
弱引用和引用队列搭配使用,如果弱引用持有的对象被回收,Java 虚拟机就会把这个弱引用加入到与之关联的引用队列中。也就是说如果 KeyedWeakReference 持有的 Activity 对象被回收,该 KeyedWeakReference 就会加入到引用队列 queue 中。 LeakCanary 就是利用这个原理。
LeakCanary 疑问?
为什么 LeakCancary 不能用于线上?
- 泄漏后生成
.hprof文件增加手机负担,引起手机卡顿等问题。.hprof 文件较大,信息回捞成问题。 - 多次调用 GC,可能会对线上性能产生影响
- 同样的泄漏问题,会重复生成 .hprof 文件,重复分析并写入磁盘
LeakCanary 为什么卡顿?解决?
自定义 Heap Dump 执行器,默认的是 AndroidDebugHeapDumper
1
2
3
4
5
6
7
LeakCanary.config = LeakCanary.config.copy(
    // 自定义 Heap Dump 执行器
    heapDumper = {
        // KOOM
        ForkJvmHeapDumper.getInstance().dump(it.absolutePath)
    }
)
- dump 放到子进程